What is a Maxwell-Boltzmann Distribution?
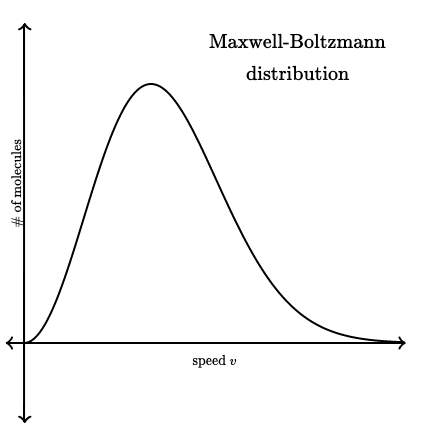
A Maxwell-Boltzmann Distribution is a probability distribution used for describing the speeds of various particles within a stationary container at a specific temperature. The distribution is often represented with a graph, with the y-axis defined as the number of molecules and the x-axis defined as the speed. In short, the graph shows the number of molecules per unit speed. Derivations of the distribution have been conceptualized as well, including Maxwell-Boltzmann statistics, which emphasizes statistical thermodynamics.
How does the Maxwell-Boltzmann Distribution work?
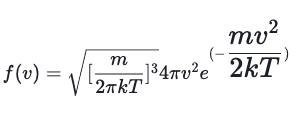
The formula for the Maxwell-Boltzmann Distribution provides the probability density as a function of the speed of the molecule. The probability density depends on the temperature of the gas (T), the mass of the molecules (m), and the Boltzmann constant (k). Either the number of molecules, or the probability density are acceptable definitions for the y-axis. Using probability density, the distribution displays the density, per unit speed, or finding a particle that has a speed near a particular value (v). The formula for the Maxwell-Boltzmann Distribution is:
Understanding the Distribution
When looking at the distribution on a graph, it is important to note that the curve skews to the left. There is a longer tail on right end of the graph as speed increases, and accordingly ends on the left at zero, as no molecule can be traveling at a speed less than zero. Furthermore, one may infer that the peak of the curve is the average speed of the gas, however it actually represents the most probable speed, and the average speed is actually located more to the right of the peak. Because the tail of the graph extends further on the right of the peak than the left, it makes sense that the average would be offset to the right of the distribution's peak.

The total area underneath the distribution curve equates to the total number of molecules in the gas. Additionally, given the knowledge that hotter gasses move quicker than colder ones, a cold gas shifts the curve to the left as the general speed of the molecules is slower than that of a hot gas. Note in the graphic below, there are a static number of molecules in the gas, and as it cools, the curve shifts further left and more narrow.
Maxwell-Boltzmann Distributions and Machine Learning
There is a specialized form of neural network known as a Boltzmann machine. The machine is an unsupervised deep learning model that primarily is used to better understand the impact of complex parameters like entropy and thermodynamics. Because the machine learns the parameters, patterns, and correlations between points in the data, the machine is deemed to be a model of unsupervised learning. The model is then used to monitor and study abnormalities in behavior based upon its training data.