What is Geometric Mean?
In mathematics, the mean of a set of numbers refers to the central or average value of the numbers in the set. Similarly, the geometric mean is the central value in a set of numbers arrived at by taking the root of nth degree of the product of n numbers in the set. It’s important to note that since the geometric mean involves taking the nth root of a number, the geometric mean can apply only to a set of positive numbers.
Geometric Mean Formula
The geometric mean is defined mathematically as follows where n equals the number of values in the set, and x is a given number within the set:

Mathematical definition of the geometric mean
Geometric Mean Formula Symbols Explained
| The mathematical product of a set of items. | |
| A discrete item in the set. | |
 |
The index number of a discrete item in the set, where i=1 denotes that you start with item 1 in the set. |
| The total number of items in the set. |
Calculating Geometric Mean
Let’s consider the following set of three numbers: {1, 2, 4}
To calculate the geometric mean of this set, let’s first find the product of our set of numbers by multiplying them all together.
(1 * 2 * 4) = 8
Next, let’s take the nth root of this product where n is equal to the number of items in our set . In this case, that means we’ll be taking the cubed root, or root of the 3rd degree:
∛(8) = 2
In short, the geometric mean of the set {1, 2, 4} is equal to 2. This can also be written as follows:
∛(1 * 2 * 4) = ∛(8) = 2
Geometric Mean vs. Arithmetic Mean
The geometric mean is better suited than the arithmetic mean to find the central tendency, or average, in a set of values when the relationship across the given set of values is non-linear or exponential. The arithmetic mean will work well to find the central tendency in a given set when the relationship between values is linear, or additive.
Calculating Geometric Mean vs. Arithmetic Mean
To exhibit the effectiveness of geometric mean vs. arithmetic mean in finding the central tendency in a set of numbers when there is an exponential, or multiplicative, relationship between each item, let’s consider the following set. Note that each item in the set is 2 times the previous number in the set:
{1, 2, 4, 8, 16, 32, 64, 128, 256, 512, 1024}
The arithmetic mean of the set is found by adding every number in the set together and dividing by the number of items in the set.
Arithmetic mean = (1 + 2 + 4 + 8 + 16 + 32 + 64 + 128 + 256 + 512 + 1024) / 11 = 186
To find the geometric mean of this same set, multiply each number in the set together and take the nth root of that product, where n is the number of items in the set.
Geometric mean = (1*2*4*8*16*32*64*128*256*512*1024)1/11 = 11√36028797000000000 = 32
In the above comparison, the arithmetic mean yields a value that is more than 5x that of the median of the set, 32. Conversely, the geometric mean yields a number that actually matches the median of the dataset, 32. While the geometric mean won’t always equal the median of a given set, this will be true whenever the multiplicative relationship between each item in the set is constant.
Geometric Mean vs. Harmonic Mean
While the geometric mean tends to be better suited to find central tendency in a set of values with a multiplicative relationship, the harmonic mean is more effective when the set contains values that are ratios.
Calculating Geometric Mean vs. Harmonic Mean
To exhibit the varying effectiveness of geometric mean vs. harmonic mean, consider calculating the average velocity of an object over a particular distance when the velocity varies.
An object travels from one point to another covering a distance of 200km. For the first half of this distance, the object travels at a velocity of 100km/h, while for the second half of this distance the object travels at 20km/h.
The geometric mean of this set would be calculated as:
Geometric mean = √(20km/h*100km/h) = 44.7km/h
The harmonic mean of this set would be calculated as:
Harmonic mean = n / (1/x1 + 1/x2) = 2 / (1/20 + 1/100) = 2 / 0.06 = 33.33km/h
To prove which of the above means is the truest mean in this scenario, it’s important to note that the above object was traveling for 6 hours. The object moved at a velocity of 100km/hr for the first half of the 200km trip, or for one hour. For the second half of the 200km trip, the object moved at a velocity of 20km/h, or for an additional 5 hrs.
The harmonic mean calculated above shows an average velocity of 33.33 km/h. If the object traveled at that velocity for the same 6 hours, it would travel exactly 200km. This same distance our object traveled in this scenario at its varying velocities.
The geometric mean calculated above shows an average velocity of 44.7km/h. If the object traveled at that velocity for the same 6 hours, it would travel roughly 268km - a distance that is 68km further than our object actually traveled.
Therefore, in this scenario, the geometric mean yields an average velocity that is less meaningful than that yielded by the harmonic mean.
Applications of Geometric Mean
The geometric mean has many applications in many different fields including medicine, finance, computer science, and elsewhere.
Medicine - Understanding Growth Rates using the Geometric Mean
In science and medicine, the geometric mean is used to understand statistical rates of growth. This growth can be human population growth or the growth of a bacteria or virus, or even of biological processes such as gene expression, a normal process which occurs in the cells of all living organisms. In such cases, the geometric mean, rather than the arithmetic mean, is relevant.
For an example of how the geometric mean is used in understanding growth rates, consider the following example of bacterial growth. You are a cancer researcher working in a lab and are trying to grow a batch of Chinese Hamster Ovary (CHO) cells in the lab to examine the effects of different anticancer compounds on these cells. You only have a few cells, and have to wait for them to multiply so you can do your different experiments.
You start off with 100 CHO cells.
After the first day, they grow to 270 cells, which is a growth rate of 270% or 2.7.
The second day, there are 700 cells, which represents a growth rate of 259% or 2.59.
The third day, there are 1600 cells, which represents a growth rate of 229% or 2.29.
This is your first time growing CHO cells, so you decide to calculate the growth rate so that you can be able to grow the right amount of cells easily next time you need more CHO cells. Geometric means work here to help you calculate the growth rate because cell growth is a nonlinear process, so arithmetic means would not be helpful.
To calculate the mean growth rate, simply calculate the geometric mean of the growth rates:
∛(2.7*2.59*2.29) = ∛(16.02) = 2.52 or 252%.
This number makes sense because the doubling time of CHO cells is about 14-17 hours. In other words, the number of CHO cells increases by 252% on average each day compared to the previous day.
To verify that the geometric mean calculated above represents a meaningful central tendency of the set of daily growth rates, calculate the outcome of uniform growth at the geometric mean for the same scenario:
If 100 CHO cells grew uniformly over a 3-day period at 252% per day, by the third day, there would be about 1600 cells. (100 * 2.52 * 2.52 * 2.52 = 1600.3). The resulting total number of cells at a constant growth rate equal to our geometric mean matches the the total number of cells in the original scenario outlined.
Knowing the average growth rate found using the geometric can be used to estimate how long cells should be grown in another experiment to achieve a desired total number of cells. For example, if you wanted to culture 10,000 cells from 100, you could apply the average growth rate from the example calculation above to estimate the number of days needed:
Day 1: 100 cells
Day 2: 100 * 2.52 = 252 cells
Day 3: 252 * 2.52 = 635 cells
Day 4: 635 * 2.52 = 1600 cells
Day 5: 1600 * 2.52 = 4032 cells
Day 6: 4032 * 2.52 = 10,160 cells
Using the geometric mean from the previous example calculation, it would take roughly 6 days to go from 100 cells to 10k cells.
Finance - Calculating Investment Returns Using the Geometric Mean
In finance, geometric mean is used to calculate the rates of annual growth of an asset. The compounded annual growth rate (CAGR) is the same as the geometric mean of the growth of an asset over time. CAGR can be used to track the growth of a stock over several years. It is defined as the rate of return that is necessary for a stock to get from its starting balance to its ending balance.
CAGR is one of the most reliable ways to measure the returns for any investment that increases or decreases in value over time. Basically, the CAGR can tell you how much a stock would have grown in value each year, had it increased in value at a steady rate over time.
To calculate CAGR, simply calculating the geometric mean of the different yearly returns to obtain an average of growth over the years. As an example, let’s calculate the CAGR of a real stock -- Amazon (NASDAQ: $AMZN) -- over the past three years using the following share prices:
January 2016: $600.
January 2017: $800 (representing a growth rate of 1.33 from the previous year)
January 2018: $1300 (representing a growth rate of 1.625 from the previous year.)
January 2019: $1600 (representing a growth rate of 1.23 from the prior year.)
The CAGR for AMZN is simply the geometric mean of the annual growth rates and is calculated as follows:
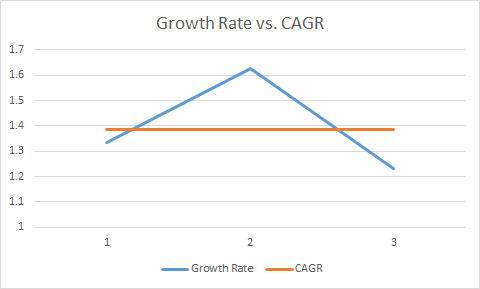
∛(1.33*1.625*1.23) = 1.39
So, you can see that the average annual growth rate from January 2016 to January 2019 for AMZN is about 1.39, or 39% growth per year.
The graph below shows the annual growth rate for 2017-2019 vs. the geometric mean calculated above. Note that the geometric mean, or CAGR, represents a value that visually appears as a central tendency within the set of annual growth rates.
Geometric Means in Water Quality Standards
The geometric mean can be used to calculate percentages of pollutants in water in order to see if the water meets water quality standards. Because measurements can be variable for toxicants on different times and on different days, it’s useful to calculate the central tendency of these observations to obtain the most accurate estimate.
For example, let’s say five samples from a local lake were obtained, each with the following E. coli levels in terms of colony forming units per 100 ml (cfu/100 ml):
Sample 1: 30 cfu/100 ml
Sample 2: 500 cfu/100 ml
Sample 3: 400 cfu/100 ml
Sample 4: 20 cfu/100 ml
Sample 5: 1 cfu/100 ml
The variation amongst these values is relatively high, anywhere from 1 to 500 colony forming units (cfu) per 100 ml. Calculating the geometric mean of each of these samples to get an average value.
To find the geometric mean of this set, first calculate the product of all values in the set:
30 * 500 * 400 * 20 * 1 = 120,000,000
Then, take the 5th root of this value: (120,000,000)^(⅕) = 41.29
This yields a geometric mean of roughly 41.29 cfu/100 ml.
The United States Environmental Protection Agency (EPA) has defined a measure known as the Maximum Acceptable Toxicant Concentration (MATC). The MATC refers to the concentration obtained by calculating the geometric mean of the lower and upper limits of these various samples. Taking the geometric mean of only the highest and lowest values (1 and 500), we get:
Sqrt (1 * 500) = 22.36
The MATC calculation is used to set standards for water quality, e.g., different levels of various chemicals which are allowed in infinitesimal levels in our water which are known to be safe levels. These levels are set in accordance with the United States Environmental Protection Agency rules and regulations as specified by the U.S. Clean Water Act.
Geometric Mean in Data Science and Machine Learning
Geometric means can be useful in machine learning and artificial intelligence applications when comparing different items which may have different properties and numerical ranges. Geometric means can be used to normalize numerical ranges of the dataset so that each item in the dataset can be directly compared. Geometric means used in AI/ML differ from arithmetic means as a larger numerical range in arithmetic mean calculations would result in a much larger effect on the average than the geometric mean calculation.
Geometric means are useful when growth is proportional or varies nonlinearly, which can be true of systems in data science and machine learning.
Geometric Mean History
The geometric mean was first invented by ancient Greek philosopher Pythagoras and his students at the Pythagorean School of Mathematics in Cortona, a coastal city in ancient Greece. In fact, Pythagoras invented all three means that exist today -- the arithmetic mean (what is typically known as the “mean) as well as the geometric mean and a third measure called the harmonic mean. Pythagoras, who sought to make sense of the world in terms of mathematics, also discovered several other mathematical concepts such as the Pythagorean theorem.